
I was working on a classification problem using machine learning and while analyzing the training data, I noticed that there were few data points which didn’t fit the distribution. These data points were making the gaussian distribution not gaussian.
To improve the accuracy of the classifier, I needed to eliminate them. For that purpose, I used Tukey’s method. It uses interquartile range to find/eliminate outliers.
What is a Quartile and how to find Interquartile range?
If we divide the data into 4 sections, each containing 25% of the data, then each section is called a Quartile. The data is sorted in an ascending order. The first 25% of the data is called 1st quartile, 25% – 50% is called the 2nd quartile, 50% – 75% is called the 3rd quartile and the last 25% is called the 4th quartile.
In Python, we can calculate quartiles as follows:
def GetQuartiles(arr):
    arr = np.sort(arr)
    mid = len(arr)/2
    if(len(arr)%2 == 0):
        Q1 = np.median(arr[:mid])
        Q3 = np.median(arr[mid:])
    else:
        Q1 = np.median(arr[:mid])
        Q3 = np.median(arr[mid+1:])
    return Q1,Q3
For the dataset shown below, the quartile are:
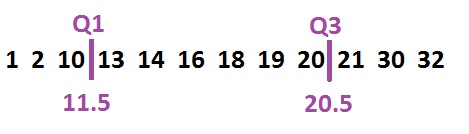
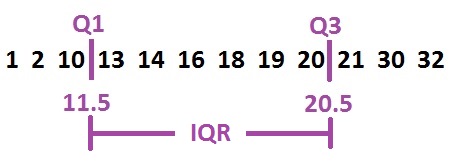
The distance between 3rd quartile and the 1st quartile is called Inter-Quartile Range (IQR.)
How to detect Outliers using IQR?
Anything which lies below (1st quartile – IQR) or above (3rd quartile + IQR) are considered as outliers. But, you can multiply a small bias with IQR to include/exclude more data points.
def EliminateOutliers(arr, bias = 1):
     q1,q3 = GetQuartiles(arr)
     iqr = q3 - q1
     lowerLimit = q1 - bias*iqr
     upperLimit = q3 + bias*iqr
     return filter(lambda x: (x > lowerLimit and x < upperLimit),arr)
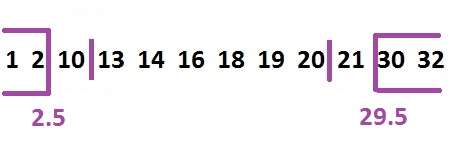
For bias = 1, the outliers are highlighted below.
This is a simple method to eliminate outliers in the data and help you to train a better classifier.
